
The Data Storyteller’s Workflow: How to Turn Social Media Metrics into Actionable Insights
Learn a social media data storytelling workflow to turn raw analytics into strategic publishing decisions across TikTok, Instagram, Facebook, and YouTube.
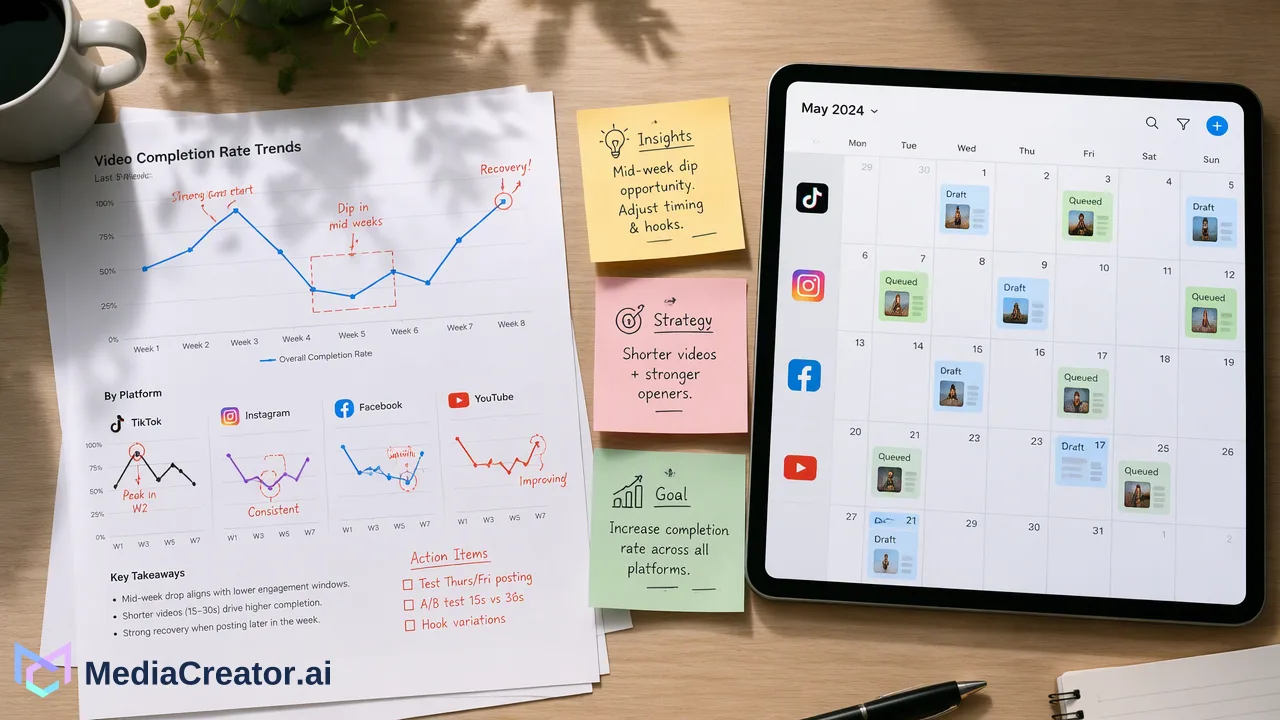
Discover how a structured social media data storytelling workflow combines quantitative metrics, strategic narrative, and clear visualization to guide content planning and inform stakeholder decisions.
A social media data storytelling workflow transforms raw platform metrics into actionable business decisions by uniting data, narrative, and visualization. Rather than simply tabulating follower counts or impression totals, data storytelling contextualizes why numbers fluctuate, what audience behaviors those shifts reflect, and how editorial teams should adapt their publishing plans. By anchoring reporting in verifiable performance data across connected channels—such as TikTok, Instagram, Facebook, and YouTube—marketing teams can establish clear narratives that inform scheduling, content formats, and stakeholder reporting.
The Three Pillars of Data Storytelling
Raw numbers rarely inspire strategic change on their own. Effective communication requires connecting quantitative evidence to practical business choices through three core pillars:
- Data: The foundation of any report consists of accurate, unaltered performance metrics pulled directly from connected social profiles. Reliable data establishes baseline trust with stakeholders and leadership. * Narrative: The narrative provides the context and explains the "why" behind the metrics. It explains whether a spike in engagement was driven by a specific campaign theme, an algorithmic distribution change, or shifting audience preferences. * Visualization: Clear visual summaries allow cross-functional teams to digest complex trends quickly. Effective charts and dashboards highlight comparative performance across channels without overwhelming viewers with unnecessary noise. When these three elements work together, social media managers move beyond reactive status updates. Instead of merely reciting what happened last week, teams provide leadership with a grounded rationale for what to produce, adapt, or retire next.
Selecting Metrics That Align with Business Goals
A common mistake in social reporting is accumulating vanity metrics that look impressive on paper but provide little guidance for business decisions. To build a meaningful data story, operators should categorize metrics by their operational objective. | Business Objective | Primary Metrics to Track | Strategic Insight Provided | | :--- | :--- | :--- | | Brand Visibility | Reach, video views, impressions | Evaluates audience expansion and top-of-funnel brand recall. | | Audience Engagement | Comments, shares, saves, replies | Measures content resonance and active community participation. | | Conversion & Action | Outbound clicks, profile visits | Informs how effectively social content directs attention toward key landing destinations. | Selecting a focused set of relevant metrics keeps stakeholders focused on key priorities. Tracking everything dilutes the narrative, whereas curating indicators tied to concrete targets helps teams evaluate whether creative tactics are delivering real value.
Structuring the Narrative: From Analysis to Presentation
Presenting data effectively requires understanding the audience reviewing the report. Executive leadership often needs high-level summaries and directional insights, while creative teams require granular, per-post postmortems to adjust production assets. To construct an effective narrative structure, teams should follow three practical steps:
- Define the Core Question: Begin with the specific operational question the report answers, such as evaluating which format drove the highest retention across video campaigns. 2. Simplify Visual Complexity: Match the chart style to the distribution platform and the viewer's expertise. Avoid cluttered multi-axis charts when a concise trend line or comparison table communicates the finding more clearly. 3. Maintain Data Integrity: Use credible, unaltered performance records. Transparently reporting both successful campaigns and underperforming posts builds credibility with decision-makers and ensures future resource allocations are based on reality.
Building an Integrated Data-Driven Workflow
A complete data storytelling workflow does not stop at slide presentations; it connects reporting directly to day-to-day publishing operations. MediaCreator.ai supports this feedback loop by allowing teams to connect accounts across TikTok, Instagram, Facebook, and YouTube via OAuth 2.0 without browser extensions or password sharing. Inside the web application, teams can review per-account and per-post performance metrics to evaluate which concepts resonated across distinct networks. These performance analytics inform posting-time recommendations, helping social media managers translate retrospective observations into future schedule adjustments. Planners can then take those timing recommendations and stage upcoming content across draft, queued, and published states on the visual publishing calendar, ensuring historical performance actively shapes forthcoming editorial distribution.
Avoiding Common Reporting Pitfalls
Even experienced teams can encounter analytical traps when compiling social reports. Awareness of these common pitfalls preserves analytical rigor:
- Bending Statistics to Fit Preconceptions: Highlighting isolated outliers while ignoring broader downward trends distorts strategy. Accurate storytelling demands an honest portrayal of performance patterns. * Ignoring the "Why" Behind the Numbers: Reporting that a post gained traction without investigating contributing factors—such as audio trends, topical relevance, or distribution timing—prevents the team from replicating success. * Confusing Reach with Impact: Large impression counts do not necessarily indicate audience resonance. Reports should distinguish between broad algorithmic impressions and genuine community interaction.
FAQ
What is the difference between a social media metric and a data story?
A metric is an isolated data point, such as impressions, link clicks, or comment volume. A data story contextualizes those individual metrics by combining them with a strategic narrative and visual presentation. It explains the underlying drivers behind performance changes, highlights relevant audience trends, and recommends practical adjustments to editorial or publishing calendars.
How do marketing teams choose which social media metrics to report?
Teams should select metrics that directly correspond to defined business goals rather than aggregate volume alone. For brand awareness, reach and video completion rates provide meaningful context. For audience engagement and community health, direct messages, comments, and saves offer deeper signal than passive impressions. Aligning metrics to specific operational goals prevents data overload and keeps reports focused on actionable findings.
How can teams use historical performance data to guide future publishing schedules?
By analyzing per-post and per-account performance trends over time, teams can identify patterns in audience responsiveness across different platforms. Reviewing historical metrics helps teams recognize which topics and formats perform consistently and allows them to apply posting-time recommendations directly to their queued calendar slots.
Learn More
Choose the product information that fits the next step in your workflow.
Get Started with MediaCreator.ai
Discover the power of AI-driven content creation
Related Articles
Continue learning with these related guides
The Collaborative Content Framework: How to Co-Author Social Campaigns with Creators
Discover how to co-author social campaigns with creators using a unified cross-platform publishing calendar and governed brand voice workflows.
BlogBuilding an Employee-Generated Content Program: A Workflow Guide for Modern Brands
Build a structured employee-generated content workflow. Learn how to align internal creators with clear briefs, review calendars, and unified social inboxes.
Blog